Original: 8 best packet sniffers and network analyzers
Author: Jon Watson
Date of publication: November 22, 2017
Translation: A. Krivoshey
Transfer date: December 2017
Packet sniffing is a colloquial term that refers to the art of analyzing network traffic. Contrary to popular belief, things like emails and web pages do not travel across the Internet in one piece. They are broken into thousands of small data packets and thus sent over the Internet. In this article, we will look at the best free network analyzers and packet sniffers.
There are many utilities that collect network traffic, and most of them use pcap (on Unix-like systems) or libcap (on Windows) as their core. Another type of utility helps analyze this data, since even a small amount of traffic can generate thousands of packets that are difficult to navigate. Almost all of these utilities differ little from each other in collecting data, the main differences being in how they analyze the data.
Analyzing network traffic requires understanding how the network works. There is no tool that can magically replace an analyst's knowledge of network fundamentals, such as the TCP "3-way handshake" that is used to initiate a connection between two devices. Analysts also need to have some understanding of the types of network traffic on a normally functioning network, such as ARP and DHCP. This knowledge is important because analytics tools will simply show you what you ask them to do. It's up to you to decide what to ask for. If you don't know what your network typically looks like, it can be difficult to know that you've found what you need in the mass of packages you've collected.
The best packet sniffers and network analyzers
Industrial tools
Let's start at the top and then work our way down to the basics. If you're dealing with an enterprise-level network, you'll need a big gun. While almost everything uses tcpdump at its core (more on that later), enterprise-grade tools can solve certain complex problems, such as correlating traffic from multiple servers, providing intelligent queries to identify problems, alerting about exceptions, and creating good graphs, which is what bosses always demand .
Enterprise-level tools are typically geared toward streaming network traffic rather than assessing the contents of packets. By this I mean that the main focus of most system administrators in the enterprise is to ensure that the network does not have performance bottlenecks. When such bottlenecks occur, the goal is usually to determine whether the problem is caused by the network or by an application on the network. On the other hand, these tools can usually handle so much traffic that they can help predict when a network segment will be fully loaded, a critical point in managing network bandwidth.
This is a very large set of IT management tools. In this article, the Deep Packet Inspection and Analysis utility, which is its component, is more appropriate. Collecting network traffic is quite simple. With tools like WireShark, basic analysis is also not a problem. But the situation is not always completely clear. On a very busy network, it can be difficult to determine even very simple things, such as:
What application on the network is generating this traffic?
- if an application is known (say a web browser), where do its users spend most of their time?
- which connections are the longest and overload the network?
Most network devices use each packet's metadata to make sure the packet goes where it needs to go. The contents of the packet are unknown to the network device. Another thing is deep packet inspection; this means that the actual contents of the package are checked. In this way, critical network information that cannot be gleaned from metadata can be discovered. Tools like those provided by SolarWinds can provide more meaningful data than just traffic flow.

Other technologies for managing data-intensive networks include NetFlow and sFlow. Each has its own strengths and weaknesses,
You can learn more about NetFlow and sFlow.
Network analysis in general is an advanced topic that is based on both acquired knowledge and practical work experience. You can train a person to have detailed knowledge of network packets, but unless that person has knowledge of the network itself and experience identifying anomalies, they won't do very well. The tools described in this article should be used by experienced network administrators who know what they want but are not sure which utility is best. They can also be used by less experienced system administrators to gain day-to-day networking experience.
Basics
The main tool for collecting network traffic is
It is an open source application that installs on almost all Unix-like operating systems. Tcpdump is an excellent data collection utility that has a very sophisticated filtering language. It is important to know how to filter data when collecting it in order to end up with a normal set of data for analysis. Capturing all the data from a network device, even on a moderately busy network, can generate too much data that is very difficult to analyze.
In some rare cases, it will be enough to print tcpdump captured data directly to the screen to find what you need. For example, while writing this article, I collected traffic and noticed that my machine was sending traffic to an IP address that I didn't know. It turns out that my machine was sending data to the Google IP address 172.217.11.142. Since I didn't have any Google products and Gmail wasn't open, I didn't know why this was happening. I checked my system and found the following:
[ ~ ]$ ps -ef | grep google user 1985 1881 0 10:16 ? 00:00:00 /opt/google/chrome/chrome --type=service
It turns out that even when Chrome is not running, it remains running as a service. I wouldn't have noticed this without packet analysis. I captured a few more data packets, but this time I gave tcpdump the task of writing the data to a file, which I then opened in Wireshark (more on this later). These are the entries:

Tcpdump is a favorite tool of system administrators because it is a command line utility. Running tcpdump does not require a GUI. For production servers, the graphical interface is rather harmful, as it consumes system resources, so command line programs are preferable. Like many modern utilities, tcpdump has a very rich and complex language that takes some time to master. A few very basic commands involve selecting a network interface to collect data from and writing that data to a file so it can be exported for analysis elsewhere. The -i and -w switches are used for this.
# tcpdump -i eth0 -w tcpdump_packets tcpdump: listening on eth0, link-type EN10MB (Ethernet), capture size 262144 bytes ^C51 packets captured
This command creates a file with the captured data:
File tcpdump_packets tcpdump_packets: tcpdump capture file (little-endian) - version 2.4 (Ethernet, capture length 262144)
The standard for such files is the pcap format. It is not text, so it can only be analyzed using programs that understand this format.
3.Windump
Most useful open source utilities end up being cloned into other operating systems. When this happens, the application is said to have been migrated. Windump is a port of tcpdump and behaves in a very similar way.
The most significant difference between Windump and tcpdump is that Windump needs the Winpcap library installed before Windump runs. Even though Windump and Winpcap are provided by the same maintainer, they must be downloaded separately.
Winpcap is a library that must be pre-installed. But Windump is an exe file that doesn't need to be installed, so you can just run it. This is something to keep in mind if you are using a Windows network. You don't have to install Windump on every machine as you can just copy it as needed, but you will need Winpcap to support Windup.
As with tcpdump, Windump can display network data for analysis, filter it in the same way, and also write the data to a pcap file for later analysis.
4. Wireshark
Wireshark is the next most famous tool in a system administrator's toolbox. It not only allows you to capture data but also provides some advanced analysis tools. Additionally, Wireshark is open source and has been ported to almost all existing server operating systems. Called Etheral, Wireshark now runs everywhere, including as a standalone, portable application.
If you're analyzing traffic on a server with a GUI, Wireshark can do everything for you. It can collect data and then analyze it all right there. However, GUIs are rare on servers, so you can collect network data remotely and then examine the resulting pcap file in Wireshark on your computer.
When you first launch Wireshark, you can either load an existing pcap file or run a traffic capture. In the latter case, you can additionally set filters to reduce the amount of data collected. If you don't specify a filter, Wireshark will simply collect all network data from the selected interface.

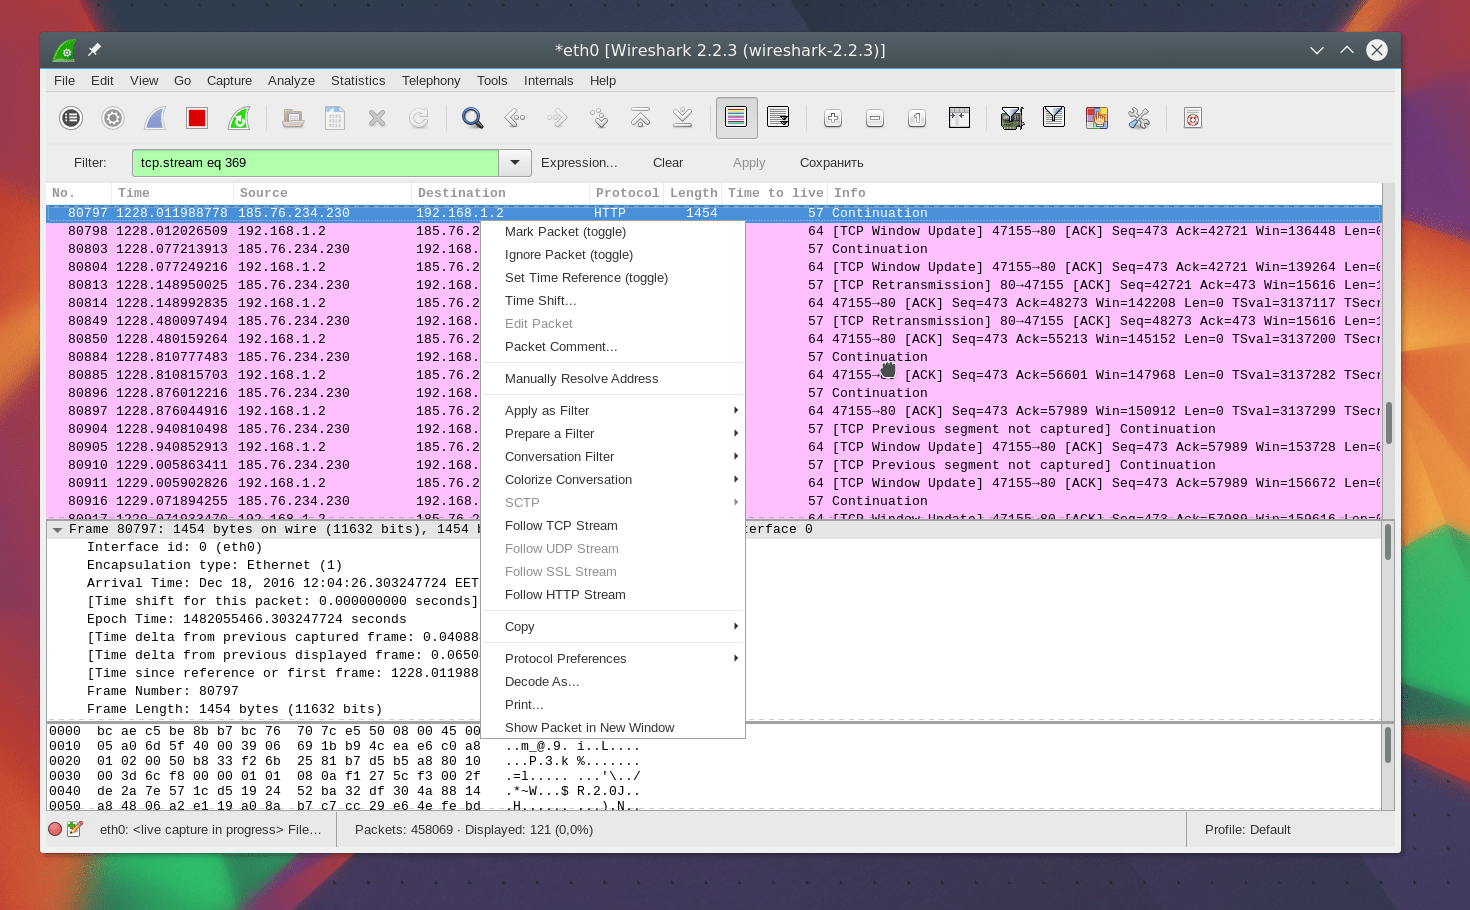
One of the most useful features of Wireshark is the ability to follow a stream. It's best to think of a thread as a chain. In the screenshot below we can see a lot of data captured, but what I was most interested in was Google's IP address. I can right click and follow the TCP stream to see the entire chain.

If the traffic was captured on another computer, you can import the PCAP file using the Wireshark File -> Open dialog. The same filters and tools are available for imported files as for captured network data.

5.tshark
Tshark is a very useful link between tcpdump and Wireshark. Tcpdump is superior at data collection and can surgically extract only the data you need, however its data analysis capabilities are very limited. Wireshark is great at both capture and analysis, but has a heavy user interface and cannot be used on servers without a GUI. Try tshark, it works on the command line.
Tshark uses the same filtering rules as Wireshark, which should not be surprising since they are essentially the same product. The command below only tells tshark to capture the destination IP address, as well as some other fields of interest from the HTTP portion of the packet.
# tshark -i eth0 -Y http.request -T fields -e ip.dst -e http.user_agent -e http.request.uri 172.20.0.122 Mozilla/5.0 (X11; Linux x86_64; rv:57.0) Gecko/20100101 Firefox /57.0 /images/title.png 172.20.0.122 Mozilla/5.0 (X11; Linux x86_64; rv:57.0) Gecko/20100101 Firefox/57.0 /images/styles/phoenix.css 172.20.0.122 Mozilla/5.0 (X11; Linux x86_64; rv:57.0) Gecko/20100101 Firefox/57.0 /images/code/jquery_lightbox/jquery_lightbox/js/jquery-1.2.6.pack.js 172.20.0.122 Mozilla/5.0 (X11; Linux x86_64; rv:57.0) Gecko/20100101 Firefox /57.0 /images/styles/index.css 172.20.0.122 Mozilla/5.0 (X11; Linux x86_64; rv:57.0) Gecko/20100101 Firefox/57.0 /images/images/title.png 172.20.0.122 Mozilla/5.0 (X11; Linux x86_64; rv:57.0) Gecko/20100101 Firefox/57.0 /favicon.ico 172.20.0.122 Mozilla/5.0 (X11; Linux x86_64; rv:57.0) Gecko/20100101 Firefox/57.0 /favicon.ico
If you want to write the traffic to a file, use the -W option to do so, and then the -r (read) switch to read it.
First capture:
# tshark -i eth0 -w tshark_packets Capturing on "eth0" 102 ^C
Read it here, or move it to another place for analysis.
# tshark -r tshark_packets -Y http.request -T fields -e ip.dst -e http.user_agent -e http.request.uri 172.20.0.122 Mozilla/5.0 (X11; Linux x86_64; rv:57.0) Gecko/20100101 Firefox /57.0 /contact 172.20.0.122 Mozilla/5.0 (X11; Linux x86_64; rv:57.0) Gecko/20100101 Firefox/57.0 /reservations/ 172.20.0.122 Mozilla/5.0 (X11; Linux x86_64; rv:57.0) Gecko/2010 0101 Firefox/ 57.0 /reservations/styles/styles.css 172.20.0.122 Mozilla/5.0 (X11; Linux x86_64; rv:57.0) Gecko/20100101 Firefox/57.0 /res/code/jquery_lightbox/jquery_lightbox/js/jquery-1.2.6.pack. js 172.20.0.122 Mozilla/5.0 (X11; Linux x86_64; rv:57.0) Gecko/20100101 Firefox/57.0 /res/styles/index.css 172.20.0.122 Mozilla/5.0 (X11; Linux x86_64; rv:57.0) Gecko/2010 0101 Firefox/57.0 /res/images/title.png
This is a very interesting tool that falls more into the category of network forensic analysis tools rather than just sniffers. The field of forensics typically deals with investigations and evidence collection, and Network Miner does this job just fine. Just as wireshark can follow a TCP stream to reconstruct an entire packet transmission chain, Network Miner can follow a stream in order to recover files that have been transferred over a network.

Network Miner can be strategically placed on the network to be able to observe and collect traffic that interests you in real time. It will not generate its own traffic on the network, so it will operate stealthily.
Network Miner can also work offline. You can use tcpdump to collect packets at a network point of interest and then import the PCAP files into Network Miner. Next, you can try to recover any files or certificates found in the recorded file.
Network Miner is made for Windows, but with Mono it can be run on any OS that supports the Mono platform, such as Linux and MacOS.
There is a free version, entry-level, but with a decent set of functions. If you need additional features such as geolocation and custom scripts, you will need to purchase a professional license.
7. Fiddler (HTTP)
It's not technically a network packet capture utility, but it's so incredibly useful that it makes it onto this list. Unlike the other tools listed here, which are designed to capture network traffic from any source, Fiddler is more of a debugging tool. It captures HTTP traffic. While many browsers already have this capability in their developer tools, Fiddler is not limited to browser traffic. Fiddler can capture any HTTP traffic on a computer, including non-web applications.

Many desktop applications use HTTP to connect to web services, and other than Fiddler, the only way to capture such traffic for analysis is to use tools like tcpdump or Wireshark. However, they operate at the packet level, so analysis requires reconstructing these packets into HTTP streams. It can be a lot of work to do simple research, and that's where Fiddler comes in. Fiddler will help you detect cookies, certificates, and other useful data sent by applications.
Fiddler is free and, like Network Miner, it can be run in Mono on almost any operating system.
8. Capsa
The Capsa network analyzer has several editions, each with different capabilities. At the first level, Capsa is free, and it essentially allows you to simply capture packets and perform basic graphical analysis on them. The dashboard is unique and can help an inexperienced system administrator quickly identify network problems. The free tier is for people who want to learn more about packages and build their analysis skills.

The free version allows you to monitor over 300 protocols, is suitable for email monitoring as well as storing email content, and it also supports triggers that can be used to trigger alerts when certain situations occur. In this regard, Capsa can be used as a support tool to some extent.
Capsa is only available for Windows 2008/Vista/7/8 and 10.
Conclusion
It is easy to understand how a system administrator can create a network monitoring infrastructure using the tools we have described. Tcpdump or Windump can be installed on all servers. A scheduler, such as cron or the Windows scheduler, starts a packet collection session at the right time and writes the collected data to a pcap file. The system administrator can then transfer these packets to the central machine and analyze them using wireshark. If the network is too large for this, enterprise-grade tools such as SolarWinds are available to turn all network packets into a manageable data set.
Read other articles about intercepting and analyzing network traffic :
- Dan Nanni, Command Line Utilities for Monitoring Network Traffic on Linux
- Paul Cobbaut, Linux System Administration. Intercepting network traffic
- Paul Ferrill, 5 Tools for Network Monitoring on Linux
- Pankaj Tanwar, Packet capture using libpcap library
- Riccardo Capecchi, Using filters in Wireshark
- Nathan Willis, Network Analysis with Wireshark
- Prashant Phatak,
In some cases, network traffic analysis is used to detect problems in the functioning of the network stack of a host and network segments. There are tools that allow you to display (listen) and analyze the operation of the network at the level of transmitted frames, network packets, network connections, datagrams and application protocols.
Depending on the situation, both the traffic of the node on which network traffic is being listened and the traffic of a network segment, router port, etc. can be available for diagnostics. Advanced traffic interception capabilities are based on "promiscuous" mode network adapter operation: all frames are processed (and not just those destined for a given MAC address and broadcast, as in normal operation).
On an Ethernet network, the following basic capabilities for listening to traffic exist:
- In a hub-based network, all collision domain traffic is available to any network station.
- In networks based on network station switches, its traffic, as well as all broadcast traffic of this segment, is available.
- Some managed switches have the ability to copy traffic from a given port to the monitoring port(“mirroring”, port monitoring).
- The use of special means (couplers) that are included in a network connection break and transmit connection traffic to a separate port.
- "Trick" with a hub- the switch port whose traffic needs to be listened to is turned on through a hub, also connecting a monitor node to the hub (in this case, in most cases, the performance of the network connection is reduced).
There are programs ( network monitors or analyzers, sniffer), which implement the function of listening to network traffic (including in promiscuous mode), displaying it or writing it to a file. Additionally, analysis software can filter traffic based on rules, decode (decipher) protocols, read statistics and diagnose some problems.
Note: A good choice of basic tool for analyzing network traffic in graphical environment is a free package wireshark[43], available for Windows and in the repositories of some Linux distributions.
tcpdump utility
The tcpdump console utility is included with most Unix systems and allows you to intercept and display network traffic [44]. The utility uses libpcap, a portable C/C++ library to capture network traffic.
To install tcpdump on Debian you can use the command:
# apt-get install tcpdump
To run this utility you must have rights superuser(in particular, due to the need to put the network adapter into "promiscuous" mode). In general, the command format is as follows:
tcpdump<опции> <фильтр-выражение>
For console output header description(decrypted data) of intercepted packets, you must specify an interface for traffic analysis (option -i):
# tcpdump -i eth0
You can disable the conversion of IP addresses to domain names (since large volumes of traffic create a large number of requests to the DNS server) - option -n:
# tcpdump -n -i eth0
To output link-level data (for example, mac addresses, etc.) use the -e option:
# tcpdump -en -i eth0
Print additional information (eg TTL, IP options) - option -v:
# tcpdump -ven -i eth0
Increasing the size of captured packets (more than 68 bytes by default) - option -s indicating the size (-s 0 - capture entire packets):
Writing to a file (directly packages - "dump") - option -w indicating the file name:
# tcpdump -w traf.dump
Reading packages from a file - option - r specifying the file name:
# tcpdump -r traf.dump
By default, tcpdump runs in promiscuous mode. The -p switch tells tcpdump to intercept only traffic destined for that host.
For more information on tcpdump filter switches and format, see the reference manual (man tcpdump).
Traffic analysis at the network interface level and network level using tcpdump
To allocate Ethernet frames, the following tcpdump constructs are used (general view):
tcpdump ether ( src | dst | host ) MAC_ADDRESS
where src is the source MAC address, dst- destination MAC address, host - src or dst, as well as for highlighting broadcast traffic.
Wireshark is a powerful network analyzer that can be used to analyze the traffic passing through your computer's network interface. You may need it to detect and solve network problems, debug your web applications, network programs or sites. Wireshark allows you to fully view the contents of a packet at all levels, so you can better understand how the network works at a low level.
All packets are captured in real time and provided in an easy-to-read format. The program supports a very powerful filtering system, color highlighting, and other features that will help you find the right packages. In this tutorial, we'll look at how to use Wireshark to analyze traffic. Recently, the developers began working on the second branch of the Wireshark 2.0 program, many changes and improvements were made to it, especially for the interface. This is what we will use in this article.
Before moving on to considering ways to analyze traffic, you need to consider what features the program supports in more detail, what protocols it can work with and what it can do. Here are the main features of the program:
- Capture packets in real time from wired or any other type of network interfaces, as well as read from a file;
- The following capture interfaces are supported: Ethernet, IEEE 802.11, PPP and local virtual interfaces;
- Packets can be filtered based on many parameters using filters;
- All known protocols are highlighted in the list in different colors, for example TCP, HTTP, FTP, DNS, ICMP and so on;
- Support for capturing VoIP call traffic;
- Decryption of HTTPS traffic is supported if a certificate is available;
- Decryption of WEP and WPA traffic of wireless networks with a key and handshake;
- Displaying network load statistics;
- View package contents for all network layers;
- Displays the time of sending and receiving packages.
The program has many other features, but these were the main ones that might interest you.
How to use Wireshark
I assume that you already have the program installed, but if not, you can install it from the official repositories. To do this, type the command in Ubuntu:
sudo apt install wireshark
After installation, you can find the program in the main menu of the distribution. You need to run Wireshark with superuser rights, because otherwise it will not be able to analyze network packets. This can be done from the main menu or via the terminal using the command for KDE:
And for Gnome/Unity:
The main window of the program is divided into three parts: the first column contains a list of network interfaces available for analysis, the second - options for opening files, and the third - help.
Network traffic analysis
To start analysis, select a network interface, for example eth0, and click the button Start.

After this, the following window will open, already with a stream of packets that pass through the interface. This window is also divided into several parts:
- Top part- these are menus and panels with various buttons;
- List of packages- then the flow of network packets that you will analyze is displayed;
- Package Contents- just below is the contents of the selected package, it is divided into categories depending on the transport level;
- Real performance- at the very bottom the contents of the package are displayed in real form, as well as in HEX form.
You can click on any package to analyze its contents:

Here we see a DNS request packet to get the site's IP address, in the request itself the domain is sent, and in the response packet we receive our question as well as the answer.
For more convenient viewing, you can open the package in a new window by double-clicking on the entry:

Wireshark filters
Manually going through packages to find the ones you need is very inconvenient, especially with an active thread. Therefore, for this task it is better to use filters. There is a special line under the menu for entering filters. You can click Expression to open the filter designer, but there are a lot of them, so we’ll look at the most basic ones:
- ip.dst- target IP address;
- ip.src- sender's IP address;
- ip.addr- IP of the sender or recipient;
- ip.proto- protocol;
- tcp.dstport- port of destination;
- tcp.srcport- sender port;
- ip.ttl- TTL filter, determines the network distance;
- http.request_uri- the requested site address.
To specify the relationship between a field and a value in a filter, you can use the following operators:
- == - equals;
- != - not equal;
- < - less;
- > - more;
- <= - less or equal;
- >= - more or equal;
- matches- regular expression;
- contains- contains.
To combine multiple expressions you can use:
- && - both expressions must be true for the package;
- || - one of the expressions may be true.
Now let's take a closer look at several filters using examples and try to understand all the signs of relationships.
First, let's filter all packets sent to 194.67.215.. Type a string in the filter field and click Apply. For convenience, Wireshark filters can be saved using the button Save:
ip.dst == 194.67.215.125

And in order to receive not only sent packets, but also those received in response from this node, you can combine two conditions:
ip.dst == 194.67.215.125 || ip.src == 194.67.215.125


We can also select transferred large files:
http.content_length > 5000
By filtering the Content-Type, we can select all the pictures that have been uploaded; Let's analyze Wireshark traffic, packets that contain the word image:
http.content_type contains image
To clear the filter, you can press the button Clear. It happens that you do not always know all the information necessary for filtering, but just want to explore the network. You can add any field of a package as a column and view its contents in the general window for each package.
For example, I want to display the TTL (time to live) of a packet as a column. To do this, open the package information, find this field in the IP section. Then call the context menu and select the option Apply As Column:


In the same way, you can create a filter based on any desired field. Select it and bring up the context menu, then click Apply as filter or Prepare as filter, then select Selected to display only the selected values, or Not selected to remove them:

The specified field and its value will be applied or, in the second case, inserted into the filter field:

In this way, you can add a field of any package or column to the filter. There is also this option in the context menu. To filter protocols, you can use simpler conditions. For example, let's analyze Wireshark traffic for the HTTP and DNS protocols:
Another interesting feature of the program is the use of Wireshark to track a specific session between the user's computer and the server. To do this, open the context menu for the package and select Follow TCP stream.
A window will then open in which you will find all the data transferred between the server and the client:

Diagnosing Wireshark problems
You may be wondering how to use Wireshark 2.0 to detect problems on your network. To do this, there is a round button in the lower left corner of the window; when you click on it, a window opens Expet Tools. In it, Wireshark collects all error messages and network problems:

The window is divided into tabs such as Errors, Warnings, Notices, Chats. The program can filter and find many network problems, and here you can see them very quickly. Wireshark filters are also supported here.

Wireshark traffic analysis
You can very easily understand what users downloaded and what files they viewed if the connection was not encrypted. The program does a very good job of extracting content.
To do this, you first need to stop traffic capture using the red square on the panel. Then open the menu File -> Export Objects -> HTTP:


This article will, to some extent, be devoted to security. I recently had an idea, how to check which applications are using the Internet connection, where traffic can flow, through which addresses the connection goes, and much more. There are users who also ask this question.
Let's say you have an access point to which only you are connected, but you notice that the connection speed is somehow low, call your provider, they note that everything is fine or something like that. What if someone is connected to your network? You can try using the methods in this article to find out which programs that require an Internet connection he uses. In general, you can use these methods as you please.
Well, let's analyze?
netstat command for analyzing network activity
This method is without using any programs, we just need the command line. Windows has a special utility called netstat that analyzes networks, let's use it.
It is advisable to run the command line as an administrator. In Windows 10, you can right-click on the Start menu and select the appropriate item.
At the command line, enter the netstat command and see a lot of interesting information:

We see connections, including their ports, addresses, active and pending connections. This is certainly cool, but it’s not enough for us. We would like to find out which program is using the network, for this we can use the –b parameter together with the netstat command, then the command will look like this:
| netstat –b |
Now the utility that uses the Internet will be visible in square brackets.

This is not the only parameter in this command; to display the full list, enter the command netstat –h .

But, as practice shows, many command line utilities do not provide the information that we would like to see, and it is not that convenient. As an alternative, we will use third party software - TCPView.
Monitoring Network Activity with TCPView
You can download the program from here. You don’t even need to install it, you just unpack it and run the utility. It is also free, but does not support the Russian language, but this is not really needed, from this article you will understand how to use it.
So, the TCPView utility monitors networks and shows in the form of a list all programs, ports, addresses and connections connected to the network.

In principle, everything is very clear here, but I will explain some points of the program:
- Column Process, of course, shows the name of the program or process.
- Column PID indicates the ID of a process connected to the network.
- Column Protocol indicates the process log.
- Column Local address– local address of the process of this computer.
- Column Local port– local port.
- Column Remote address indicates the address to which the program is connected.
- Column State– indicates the connection status.
- Where indicated Sent Packets And RCVD Packets indicates the number of packets sent and received, same with the columns Bytes.
You can also use the program to right-click on a process and terminate it, or see where it is located.

Address names as shown in the image below can be converted to a local address by pressing hotkeys Ctrl+R.

If you see lines of different colors, for example, green, then this means a new connection is starting, if red appears, then the connection is completed.
That's all the basic settings of the program, there are also small parameters, such as setting the font and saving the connection list.
If you liked this program, then be sure to use it. Experienced users will definitely find what purposes to use it for.
Recently, while discussing the question in one chat: as fromWiresharkpull out the file, the NetworkMiner utility popped up. After talking with colleagues and googling on the Internet, I concluded that not many people know about this utility. Since the utility greatly simplifies the life of a researcher/pentester, I will correct this shortcoming and tell the community about what NetworkMiner is.
NetworkMiner– a utility for intercepting and analyzing network traffic between local network hosts, written for Windows OS (but also works in Linux, Mac OS X, FreeBSD).
NetworkMiner can be used as a passive sniffer of network packets, the analysis of which will detect the fingerprint of operating systems, sessions, hosts, as well as open ports. NetworkMiner also allows you to analyze PCAP files offline and recover transferred files and security certificates.
Official page of the utility: http://www.netresec.com/?page=Networkminer
And so, let's begin to consider.
The utility is available in two editions: Free and Professional (cost 700 USD).
The following options are available in the Free edition:
- traffic interception;
- PCAP file parsing;
- receiving PCAP file via IP;
- OS definition.
The Professional edition adds the following options:
- parsing PcapNG file,
- Port protocol definition,
- Export data to CSV/Excel,
- Checking DNS names on the site http://www.alexa.com/topsites,
- Localization by IP,
- Command line support.
In this article we will look at the option of parsing a PCAP file received from Wireshark.
But first, let's install NetworkMiner in Kali Linux.
- By default, Mono packages are already installed in KaliLinux, but if they are not installed, then perform the following action:
sudo apt-get install libmono-winforms2.0-cil
- Next, download and install NetworkMiner
wget sf.net/projects/networkminer/files/latest -O /tmp/nm.zip
sudo unzip /tmp/nm.zip -d /opt/
cd /opt/NetworkMiner*
sudo chmod +x NetworkMiner.exe
sudo chmod -R go+w AsscodebledFiles/
sudo chmod -R go+w Captures/
- To start NetworkMiner use the following command:
mono NetworkMiner.exe

For information. Five minutes of traffic interception on our test network collected more than 30,000 different packets.

As you understand, analyzing such traffic is quite labor-intensive and time-consuming. Wireshark has built-in filters and is quite flexible, but what to do when you need to quickly analyze traffic without exploring the full variety of Wireshark?
Let's try to see what information NetworkMiner will provide us.
- Open the resulting PCAP in NetworkMiner. It took less than a minute to analyze a traffic dump of more than 30,000 packets.

- The Hosts tab provides a list of all hosts involved in traffic generation, with detailed information for each host:

- On the Frames tab, traffic is presented in the form of packets with information for each layer of the OSI model (Channel, Network and Transport).

- The next Credentials tab will show intercepted authorization attempts in clear text. So, in less than a minute, you can immediately get a login and password for authorization from a large traffic dump. I did this using my router as an example.

- And one more tab that makes it easier to obtain data from traffic is Files.
In our example, I came across a pdf file that you can immediately open and view.

But most of all I was surprised when I found a txt file in the traffic dump, which turned out to be from my DIR-620 router. So this router, when authorized on it, transmits in text form all its settings and passwords, including those for WPA2.
As a result, the utility turned out to be quite interesting and useful.
I give you, dear reader, this article to read, and I went to buy a new router.


